The implied volatility is the single most important descriptor of options contracts. There are generally a large number of available contracts given the different strikes and expiries for a given underlying instrument. Generally a table of options contracts quotes looks like this:
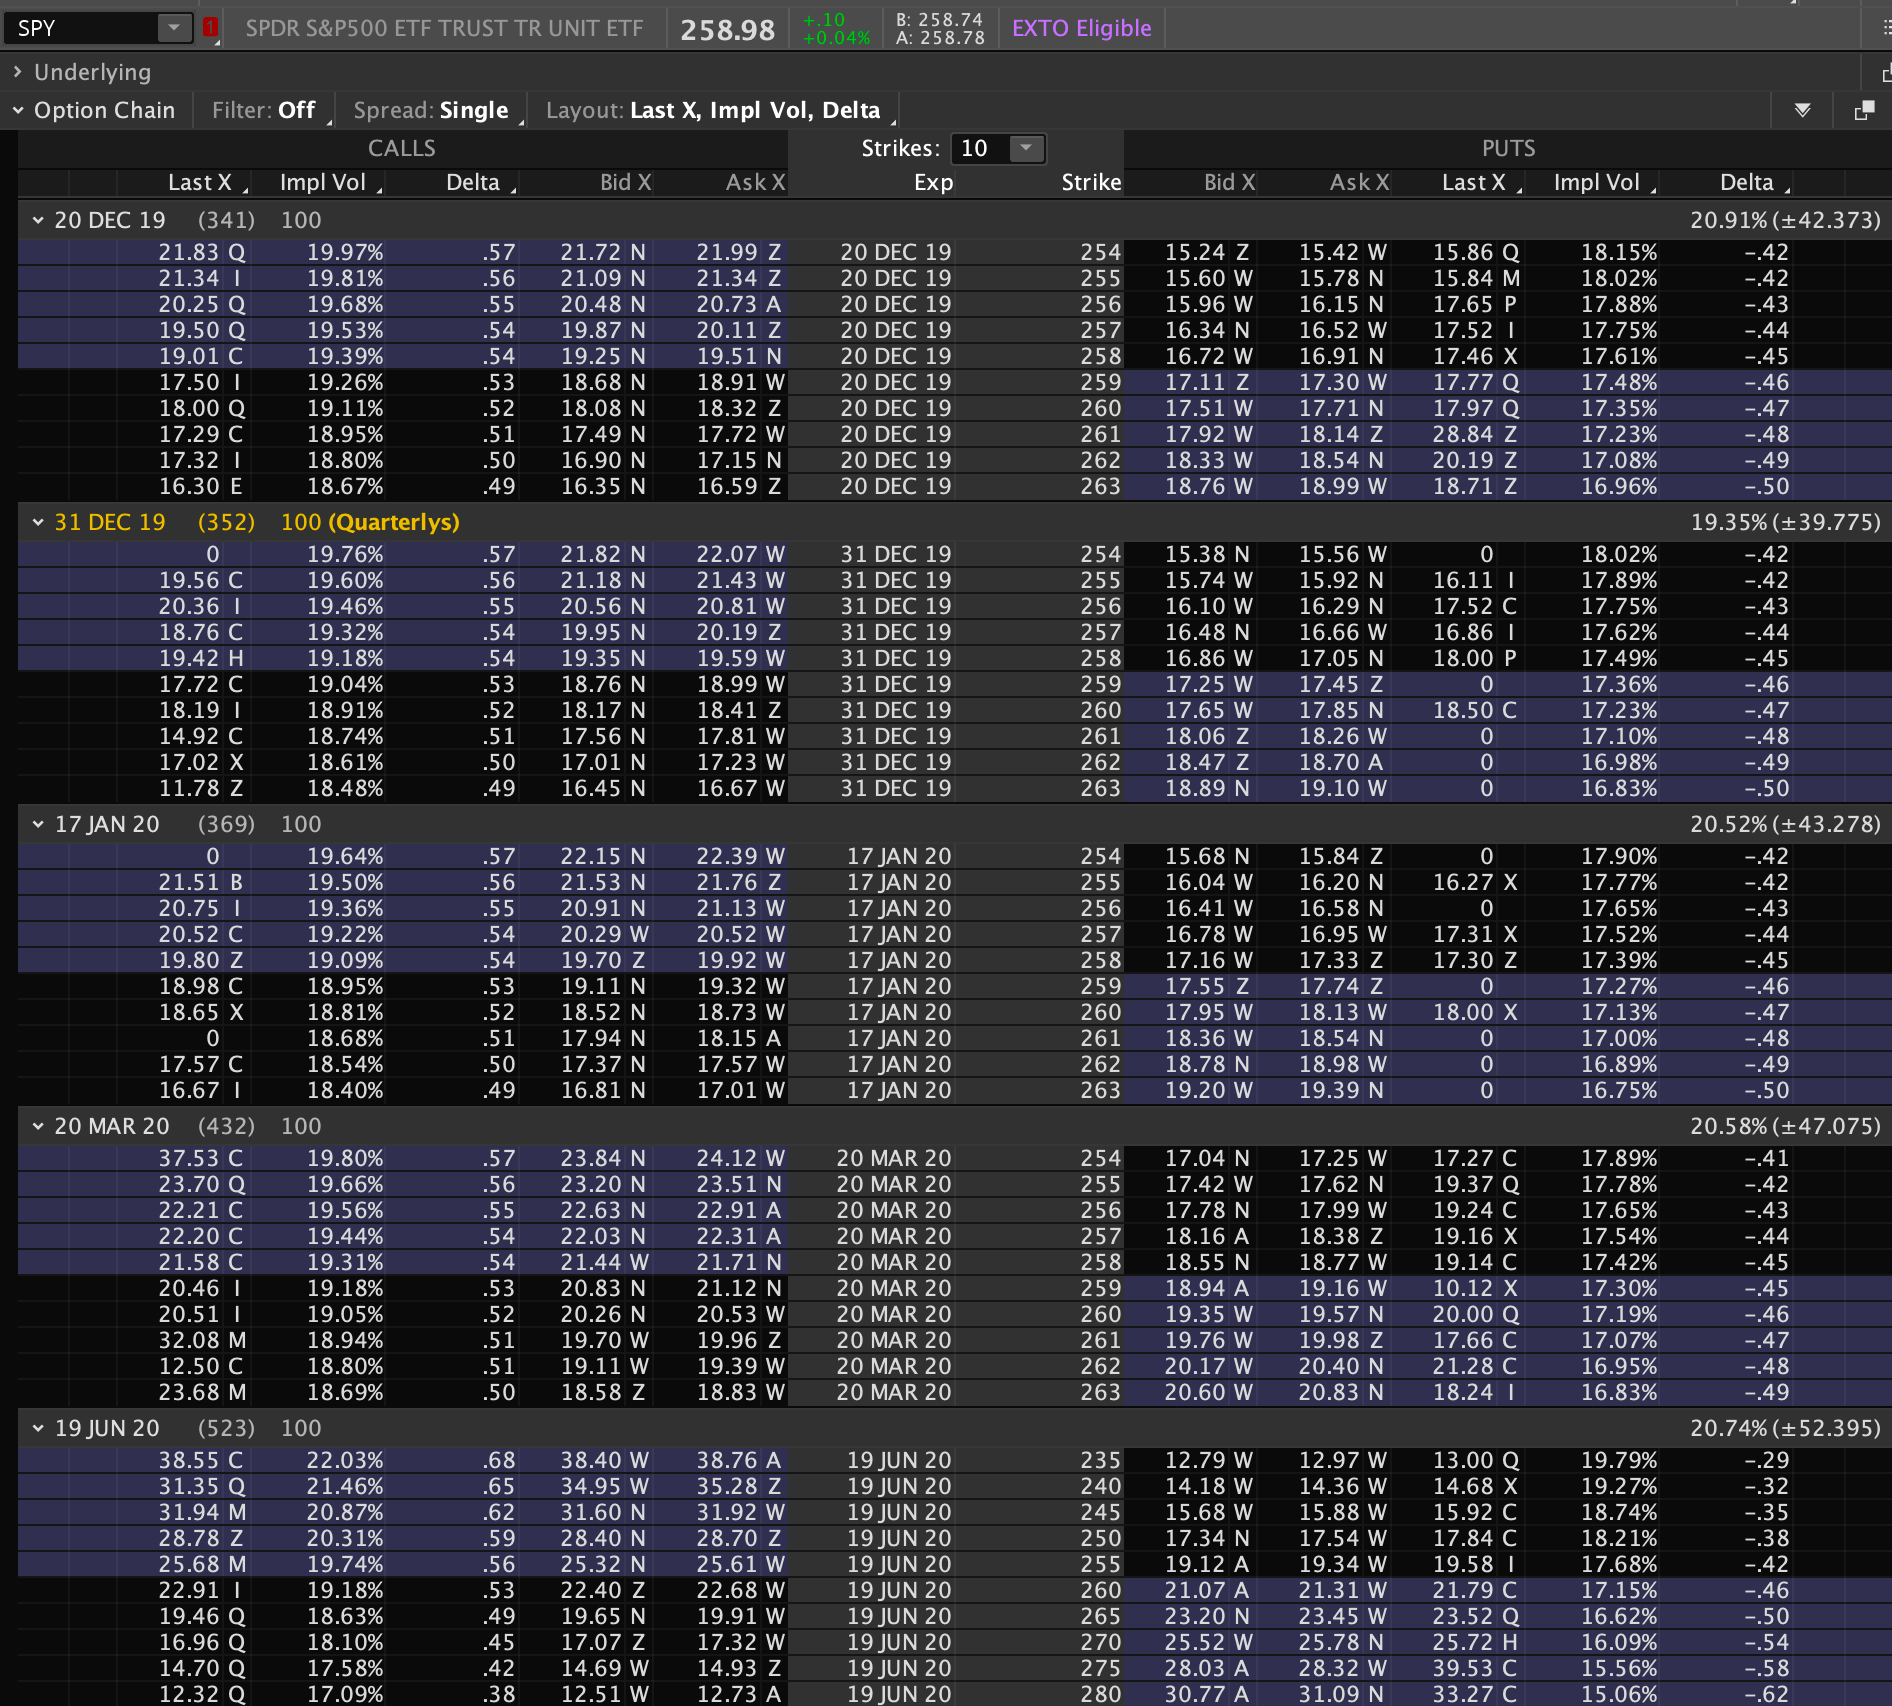
The table above is still excluding the majority of strikes & dates. You can often see different patterns of implied depending on the beliefs of market participants. Future political or corporate events may show up as bumps of IV. Differences in concerns or beliefs about the future risks of the underlying may show up as a skew.
I’ve often wanted to view this visualized as a 3D surface, however, I’m to poor to be able to afford a Bloomberg Terminal. I worked on a 3D surface viewer using exported CBOE pricing data that can be run on the browser. This is still very much a work in progress.
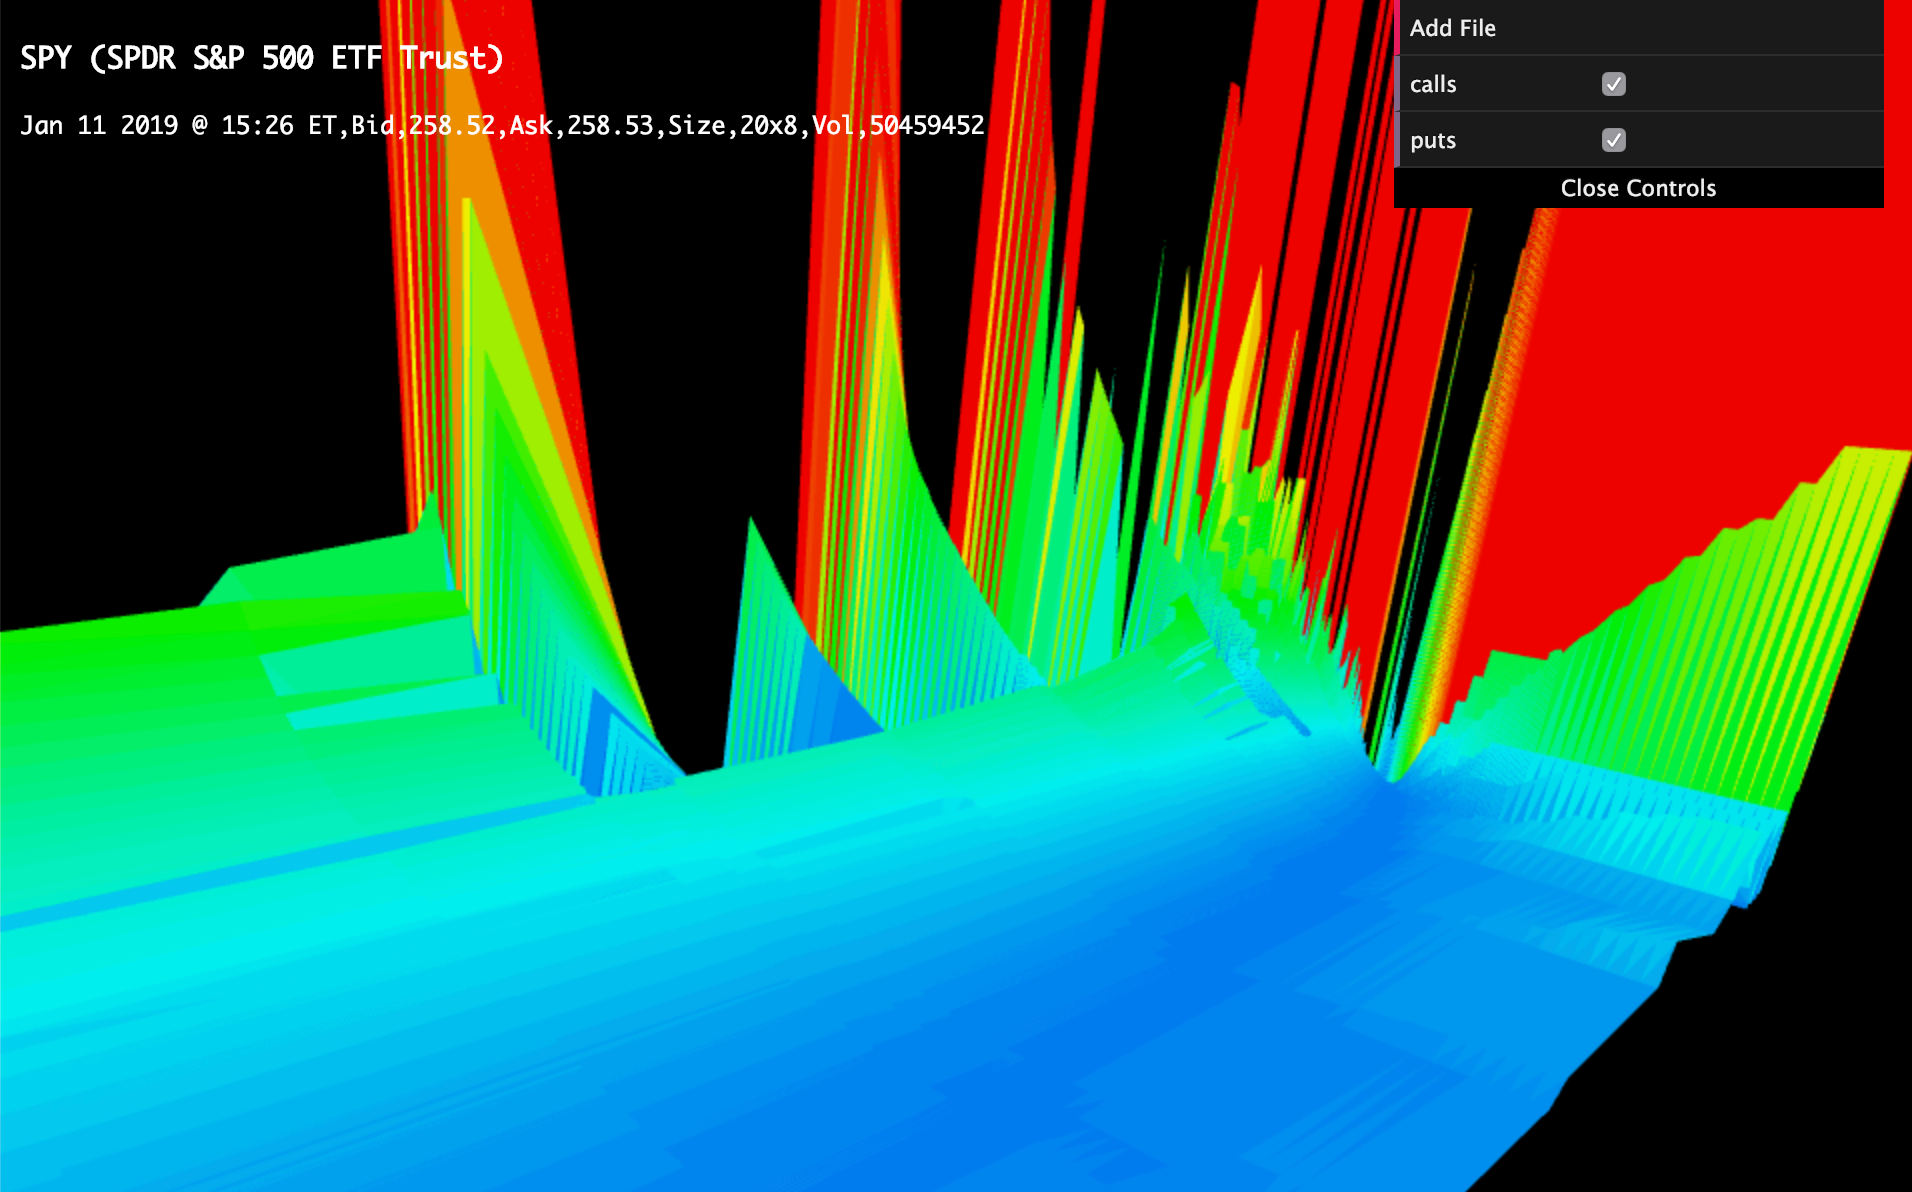
You can see the surface, but it’s mega ugly in certain parts due to illiquid pricing. In addition to adding more analytical information, I will be adding either some sort of interpolation or parameterization.
You can check out the code & try it out for yourself on github https://github.com/hyobyun/VolSurface
finance software-engineering