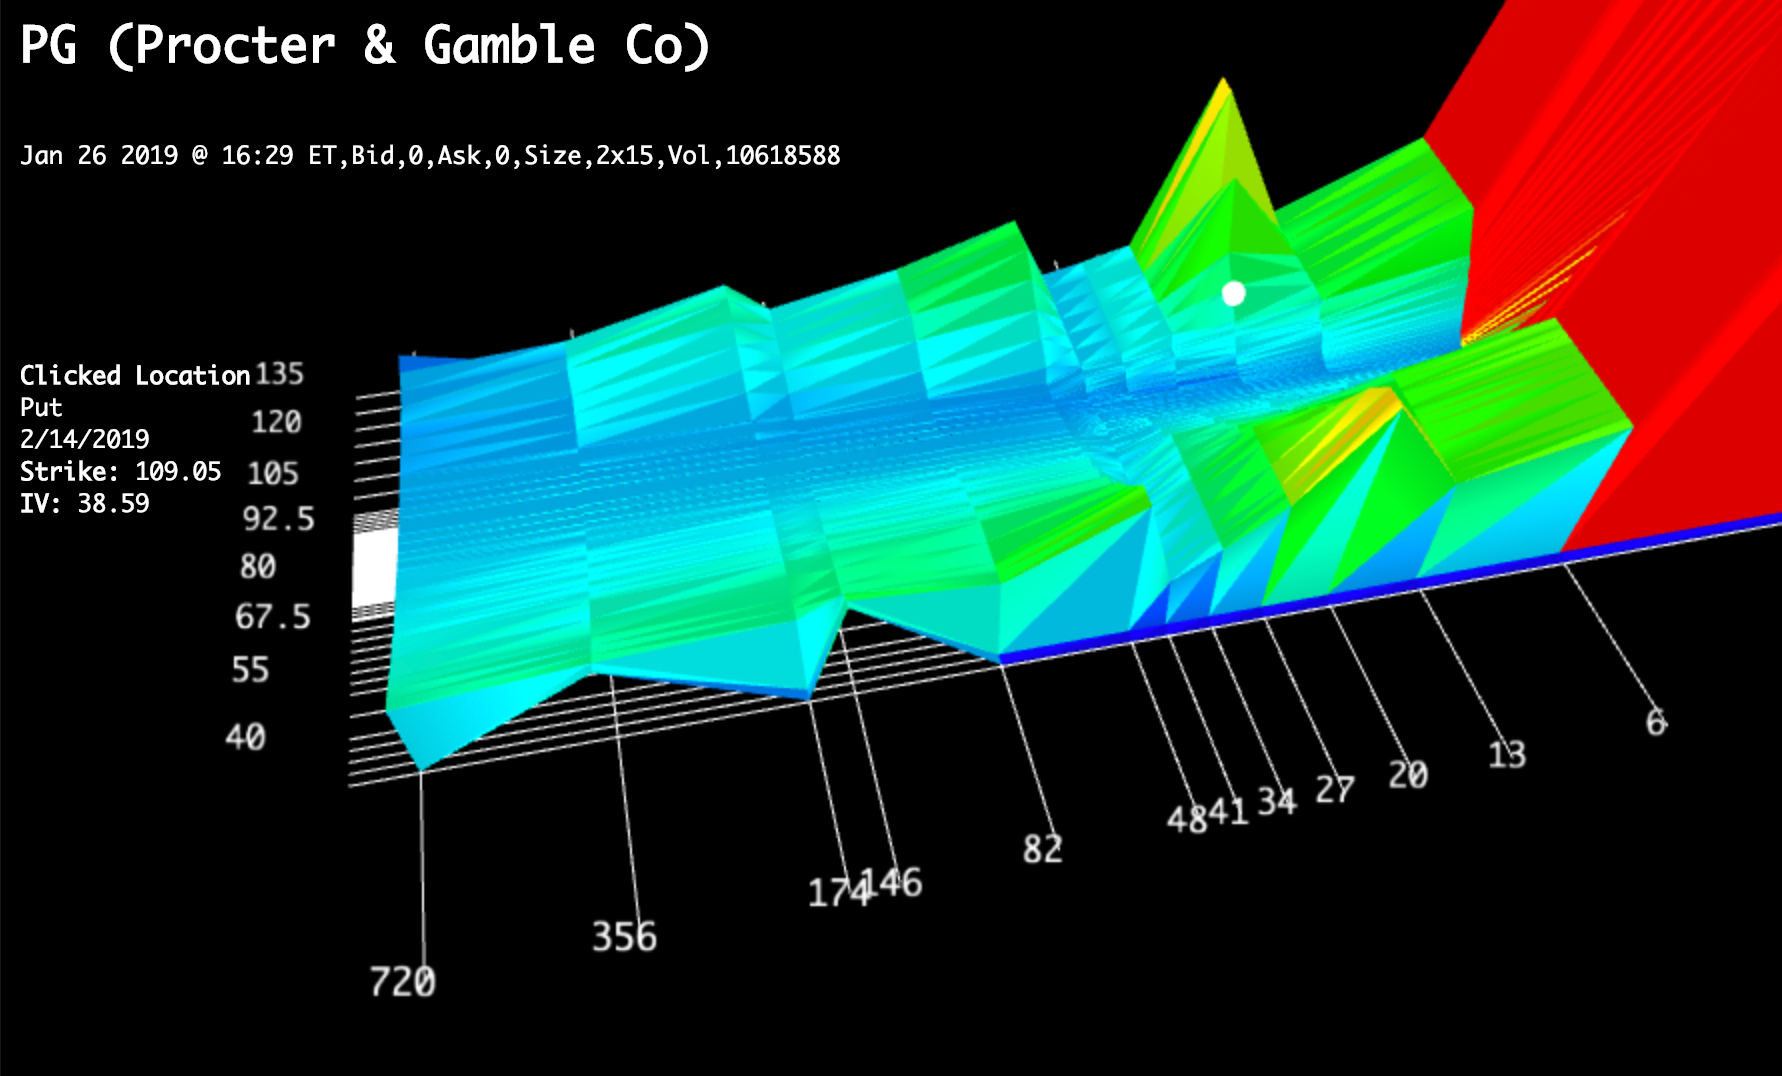
I finally added some updates to the Volatility Surface Visualizer that will allow you to finally get quantitative data from it (at GitHub). I also added some rudimentary empty fill interpolation to make the surface prettier. Furthermore, I finally added axes and ray casted value reader. Just click on the surface, and you can see the interpolated date, strike, and IV.
 Interpolation / Parameterization
I wasn’t really aware when I started this project, but this seems to be a subject that is far more complex that I had originally anticipated. The pricing data straight from CBOE becomes fairly ugly very quickly for the illiquid contracts. In order the make the surface less chaotic, I really prefer some sort of interpolation or parameterization.
Currently, the viewer uses a pretty rudimentary strategy. The surface is populated on a grid of all observed strikes and expirations. For all expirations, from the current price, an empty fill is done for all missing values - middle out. This gets the job done for now.
Popular strategies such as Arbitrage-free SVI volatility surfaces (pdf) exist, but for my purposes, I don’t know if the juice is worth the squeeze.
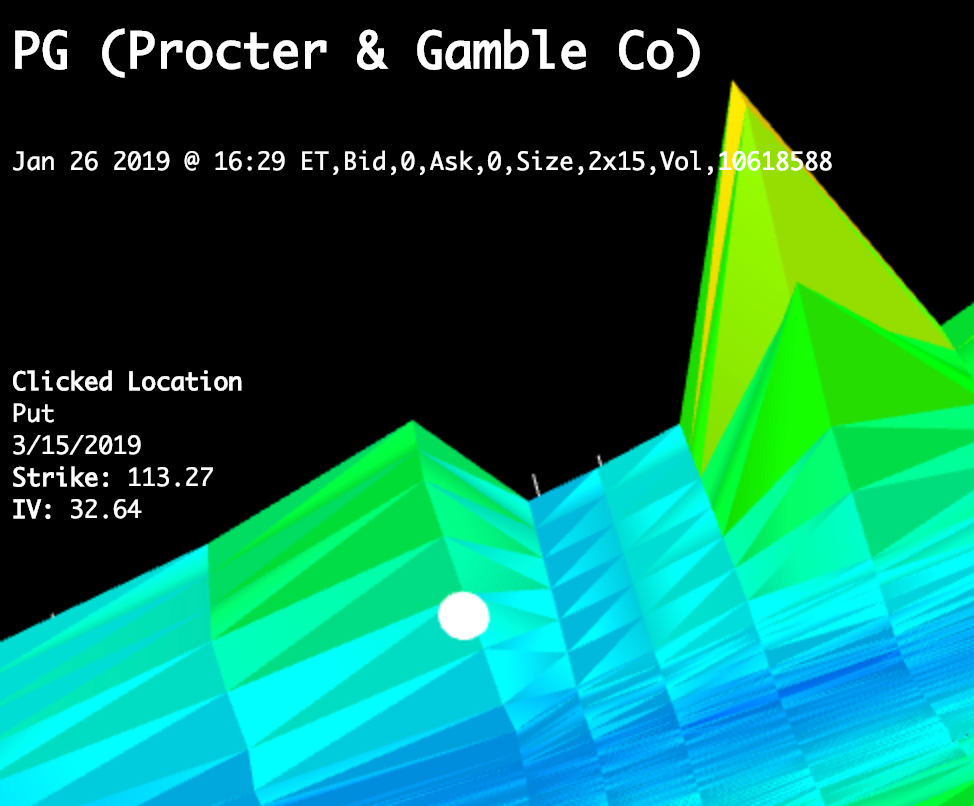
Ray Cast Value Viewer
Now you can click anywhere on the surface and see the interpolated strike, price, and Implied Volatility.